Smart Water Management of the Piara Waters Sporting Oval
SWAN Systems – Piara Waters Sporting Oval, Case Study
Background
The Piara Waters sporting complex within the City of Armadale includes a sports field of approximately three hectares irrigated with bore water (Figure 1). It is a high profile site designed for both winter and summer use, and requires a high standard of presentation.
It has high irrigation uniformity standards and is equipped with long term loggers that automatically collect flow and soil moisture data. Parks managers were concerned that although data was being collected they needed a way to make better use of it to ensure they achieved maximum water use efficiency. The SWAN Systems1 software service was seen as a way of getting the site specific information needed to achieve efficiency outcomes and to track and report water use compared to budgeted allocations.
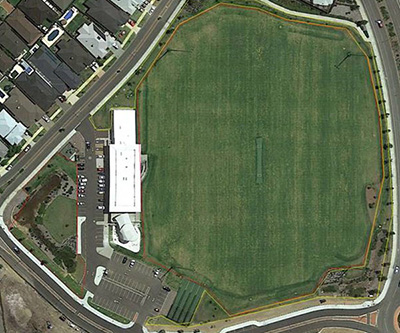
Figure 1. Satellite view of Piara Waters sporting complex showing the irrigated sports field (2.65 ha), associated landscaping (0.63 ha), and modern community facilities.
Challenges
The City’s population is predicted to double by 2030, requiring approximately another 150 hectares of public open space. Future groundwater availability is, however, limited and the City faces a major challenge to meet community expectations for the provision of playing fields, parks and other public open space with limited water resources.
The Piara Waters oval is located within a fully allocated groundwater area and is close to both wetland and public drinking water resource protection areas where excess nutrient leaching could be a threat to water quality. Construction of the oval had to overcome the existing high watertable by the use of sub-surface drainage, further raising the risks related to nutrient loss through excess drainage.
Maximum water use efficiency and operating within licensed allocation limits are important aspects to meeting these challenges. Initially flow meters were installed to accurately measure water usage on irrigated areas. Subsequently, data loggers were installed to automatically collect and store monitoring data. The next step was to ensure the data being collected was used effectively for optimal turf production with minimum waste. SWAN Systems provided the ideal tool to facilitate this.
Ken Johnston, senior consultant from Sports Turf Technology said: “Life for park managers is definitely getting more complex. Increasingly they have to manage and make sense of large amounts of data from various sources. This needs to be stored efficiently and used effectively to realise the impacts that the smart monitoring devices, which are so readily available now, can provide. Automated data collection and analysis saves time and evidence based information is empowering for everyone involved, but it has to be easy to get and easy to interpret and apply, otherwise the barriers to adoption are too strong. SWAN does that for them”, he said.
How SWAN Systems Helped
The approach for this trial was to upload historical daily data to SWAN Systems for the 2016/2017 season and collect 2017/2018 data in real time. Active use of SWAN’s software for water management began in January 2018 supported by turf management advice from Sports Turf Technology. The 2016/17 and 2017/18 irrigation seasons were each noted as having cool summers and were shown to be quite comparable for monthly evapotranspiration (ETo) and even rainfall – there was one significant (~100 mm) summer rainfall event in each year.
The oval was set up in SWAN by entering site characteristics and creating a link to local weather observations, and a seasonal water budget of 9,000 kL/ha was set. This budget was flexible and could be adjusted, depending on actual demands, within the constraints of the bulk water licence, which covers a range of parks and reserves.
The 2016/17 season was analysed retrospectively and the 2017/18 season was actively managed using data collected daily. Water use and outcomes were then compared between the seasons.
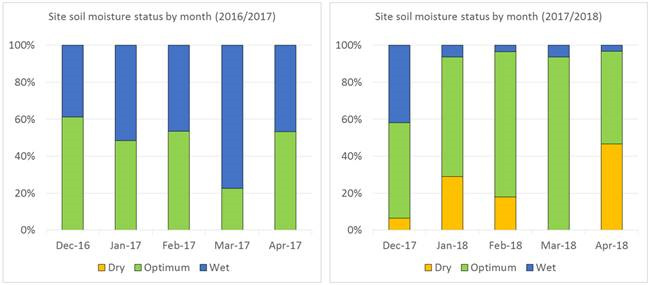
Figure 2. Soil moisture status for Piara Waters, for the summer and autumn months in 2016/17 and 2107/18. The percentage figures for Dry, Optimum or Wet, the proportion of days in each month that soil moisture status was determined to be in those categories, are displayed using SWAN’s reporting function. At this site, “Wet” means the soil was above field capacity (31% by volume) and subject to drainage. Soil was assessed as “Dry” if soil moisture was below 20%, a level well above the permanent wilting point of 15% for the soil type.
Results and Future Plans
The trial used SWAN Systems to track irrigation application, soil moisture status and drainage. SWAN estimates drainage as the amount of water that is surplus to plant needs and which therefore drains below the root zone. The first point to note is that, in aggregate, there was a 16% water saving in 2017/18 compared to 2016/17 for the September – April irrigation season (Table 1). Usage during 2017/18, although still a little over actual requirements and budget, was much improved compared to 2016/17. Note that most of this saving for 2017/18 was in the second half of the season – water use from January to April was 25% less in 2017/18 than 2016/17. This followed the adoption of active monitoring and ready access to information, providing certainty that risks to turf condition related to water saving efforts were low.
Drainage modelled by SWAN was 40% less for the 2017/18 season (Table 1). Drainage events were confirmed by the soil moisture probe data – high irrigation application during late spring (October to November 2017) accounted for much of the drainage during the 2017/18 season. This is an important outcome especially in areas where the risk to water quality from nutrient leaching is high.
As drainage occurs when soil wetness exceeds field capacity, further insight into the success of modified irrigation management practices can be gleaned by examination of the site’s soil moisture during the season. As can be seen in Figure 2, soil was “Wet” substantially more of the time in 2016/17 than in 2017/18, which was more frequently maintained in the “Optimum” zone.

Table 1. Comparison of water use and outcomes for 2016/17 and 2017/18 irrigation seasons at Piara Waters, City of Armadale. Drainage estimates exclude drainage due to rainfall.
Alex Pass said that the SWAN trial had been very useful in providing science and data to support management decisions. He also found particular value in the capacity to predict effects on soil moisture before implementing changes to irrigation programs, and this made a difference to water usage patterns and allowed run times to be reduced.
“We were doing more with less” , he said. “The turf is looking healthy and we’re using less water to achieve it. Using SWAN gave us some eyes in the soil and gave a clear indication when things were on target, while avoiding ‘set-and-forget’ complacency. We hope to use SWAN on a larger number of sites to begin to increase the impacts over all our POS assets from our investment in improved irrigation design, data loggers and soil moisture probes.”
Footnotes
1 – SWAN is a cloud-based system that can automatically collect and store weather, irrigation, soil moisture, and fertiliser application data. The software analyses the data to provide recommendations for best practice irrigation – it takes the guesswork out of optimising water use. It also provides integrated modules for nutrient planning and management, and high resolution satellite imagery is used to generate a health (or “greenness”) index for specific sites.
Are you ready to start making data-backed decisions around water and nutrient allocation? Request a free discussion with one of our irrigation experts to discover whether your systems are optimised.
