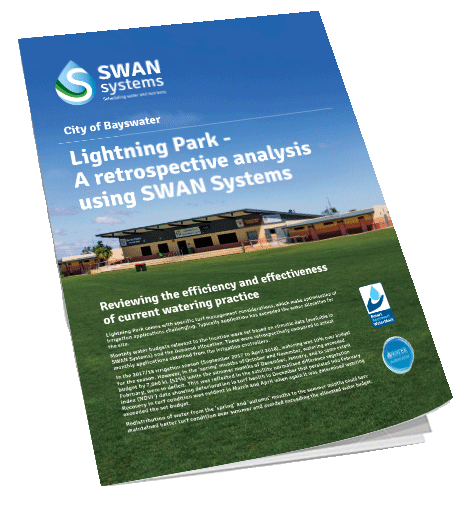
Lightning Park, City of Bayswater – A Retrospective Analysis Using SWAN Systems
SWAN Systems – Lightning Park, City of Bayswater Case Study
Background
The City of Bayswater encompasses approximately 35 km2, and includes over 30 active sporting reserves to encourage healthy, active lifestyles.
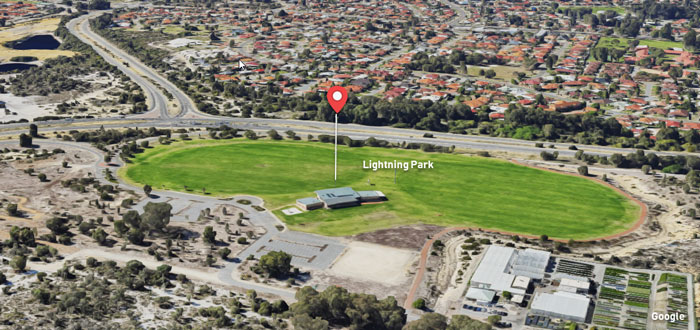
Lightning Park is one of the City’s premier active sporting fields, with two full size AFL ovals, as well as passive recreational areas. The adjacent Lightning Swamp is one of the last remaining natural habitats managed by the City. Water needs to be managed to ensure premium turf is maintained, and leaching, which could further threaten swamp water quality by increasing nutrient levels, is minimised. The City trialled SWAN Systems2 to determine if it could assist them in managing their allocated water budget and environmental nutrient levels.
Challenges
Lightning Park is a challenging site with a shallow root zone due to sting nematode infestation. This, together with coarse sandy soils, makes it difficult to maintain correct soil moisture and suitable turf condition. Temporary wilting of the turf has been a regular occurrence during the hot summer months. As a result of this a higher than normal allocation of 9,500 kL/ha (950mm) was assigned to the site, leading to a total allocation of 61,500 kL for the 6.5 ha site. End of season assessment has shown water use has typically exceeded this amount.
A soil moisture probe (SMP) had been installed to monitor soil moisture status as an aid to scheduling, however this data needed to be combined with data from other sources in order to provide information to guide management decisions. The irrigators could see potential for SWAN Systems to do this efficiently and effectively by automatically combining the SMP data with forecast weather to estimate the impacts of evapotranspiration, predicted rainfall and planned irrigation timing and volume on current and future soil moisture status.
SWAN would also enable them to track and display water use compared to budget in real time and readily access high resolution satellite plant health (NDVI) information to help assess the impacts of management changes.
How SWAN Systems Helped
SWAN Systems was used as a diagnostic tool to analyse and evaluate actual 2017/18 water use in relation to monthly water budgets and estimated plant demands. Turf condition was assessed using high resolution NDVI imagery available via SWAN, and leaching of water (and therefore nutrients) past the rootzone was estimated.
The site was established in SWAN using its mapping facility and the required equipment (in this case a soil moisture probe, flow meter and on-site rain gauge) added (see Figure 1). To account for infestation by sting nematodes the effective rooting zone was set at 0.15m.
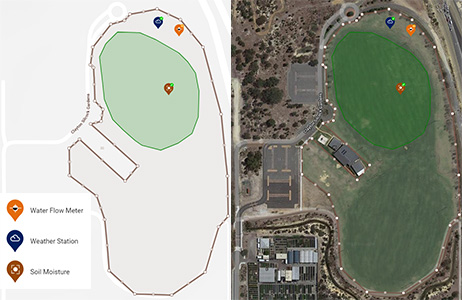
Figure 1. Lightning Park trial area established in SWAN showing equipment locations and the site area defined.
Automatic collection of SMP data and local (metropolitan Perth) BoM weather forecast and observation data was established. Historical site rainfall data and the 2017/18 season monthly flow volumes obtained from the Aquamonix controllers were uploaded manually into SWAN.
SWAN’s water budgeting tool was then used to distribute the 9,500 kL/ha allocation in proportion to monthly average plant demands for the 2017/18 irrigation season.
Once data were loaded, evaluation was done using SWAN’s analytics and reporting functions.
Results and Future Plans
Water usage
Total usage in 2017/18 was 68,000 kL, which was 6,500 kL (10.6%) over the site’s allocation. The irrigation season cumulative water usage trend (Figure 2) implies that for much of the season the water use was on target. However, it also shows that despite no water being applied in September, which saved the budgeted amount of 3,500 kL, usage had crossed the budget line by the end of October, and by the end of November usage was significantly over budget. This over budget situation persisted through December and January despite watering in this period being under budget. In mid-February the trend line for running actual water use again diverged upwards from the budget line (Figure 2). This was due to applications being increased in response to the deterioration of turf health, which was evident from NDVI data during that time (see Figure 3). Over budget application continued until irrigation stopped in mid-April.
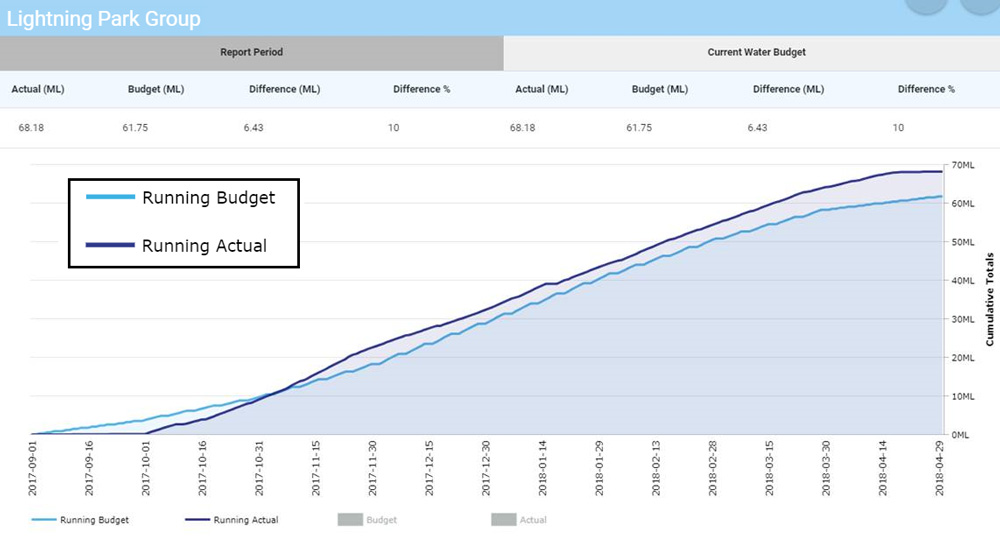
Figure 2. Retrospective plot generated by SWAN showing the cumulative (running) budgeted and actual water use for the season with a year to date summary at the top of the graph.
Table 1 shows water budgets, actual usage, and deficits or excesses (last column) on a monthly basis. Over budget amounts applied early in the season could have covered the deficits apparent in December and January. This would have helped to maintain turf condition and potentially avoided the over-watering that occurred in February where water applications appeared to have been constrained until the middle of the month after which additional watering to restore turf condition took place. This over budget watering continued through March and April and led to some turf recovery (see Figure 3).
Table 1. Monthly water balance for Lightning Park showing over and under budget amounts (last column) for the 2017/18 irrigation season
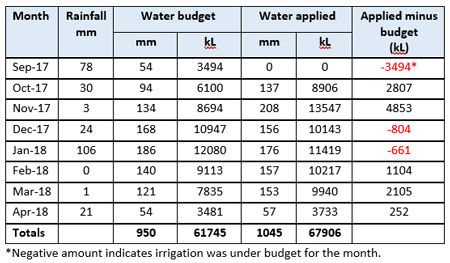

Figure 3. Satellite NDVI (greeness index or plant health) imagery of Lightning Park for the 2017/18 irrigation season. False colour imagery shows turf improvement from September peaking in November then deterioration in December through to February as watering fell below budget. Recovery is evident in March and April following over budget irrigation (Table 1).
Soil Moisture Status and Drainage
SWAN Systems shows that the site root zone was calculated as being too wet one-third of the time and at optimum moisture for two-thirds of the time (Figure 4). High soil moisture (especially in late spring) is associated with drainage below the root zone. Excluding drainage due to rainfall, approximately 110 mm of irrigation water (nearly 10% of water applied) drained below a depth of 150 mm. Avoiding that drainage would have kept the 2017/18 season within allocation.
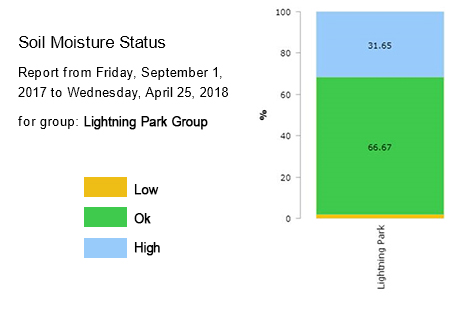
Figure 4. Summary of Lightning Park’s soil moisture status for the 2017/18 irrigation season showing percentage of time soil moisture was too wet, optimum or too dry.
Future Plans
As part of the analysis for this trial, SWAN Systems was used to retrospectively test the water demand using daily weather data recorded for the site during the 2017/18 season. This indicated that the actual demand for a mid-April finish was ~1,075 mm – 13% more than budgeted assuming that the September water requirement was met. When the September component is ignored in order to mimic the 2017/18 practice (Table 1), the equivalent SWAN seasonal demand was 1,000 mm/ha; about 5% less than actual use, and 5% more than budget.
The indications are that SWAN’s precision can help save water, but the allocation of 950 mm/ha may not have been adequate. The City of Bayswater plan to adopt SWAN’s full scheduling capability in 2018/19 to take on the lessons from the 2017/18 season and to more accurately evaluate these indications.
Moreover, to increase the efficiency of data management, the suppliers of the irrigation system, Aquamonix, will assist by ensuring flow data can be uploaded from their controllers directly into SWAN Systems.
Sting nematode research at the site indicates control methods have limited efficacy and as a result the effective root zone may only be 75 to 100 mm. SWAN can be used to assess the impact on water requirement when the rootzone is reduced from the 150 mm used in the current analysis. The results could be used to influence practice and policy for sites where sting nematode infestation is high.
Footnotes
1 – Normalised Difference Vegetation Index: provides a measure of plant health by assessing the amount of live green vegetation present.
2 – SWAN is a cloud-based system that can automatically collect and store weather, irrigation, soil moisture, and fertiliser application data. The software analyses the data to provide recommendations for optimised irrigation – it takes the guesswork out of optimising water use. It also provides integrated modules for nutrient planning and management, and satellite data is used to generate a health (or “greenness”) index for sites based on absorption and reflectance data.

Are you ready to start making data-backed decisions around water and nutrient allocation? Discover how the SWAN difference can help your business meet your growth and efficiency goals – contact us or book a free demo today.


