Alkimos Beach Urban Development – 30% Water Saving Using SWAN Systems
SWAN Systems – Leatherback Oval, Alkimos Beach Case Study
Background
Alkimos Beach is a greenfield coastal development subject to impacts from groundwater scarcity and a changing climate. The estate has recently received two prestigious national awards as Best Residential Development for 2018 by the Urban Development Institute of Australia, and Best Masterplanned Community for 2018 by the Property Council of Australia. It is also Australia’s first 6 Star Green Star rated community, committing it to reducing the project’s impacts on land, water, and the atmosphere. To mitigate potential issues, smart water initiatives have been implemented throughout the 224 hectare development, with significant areas of public open space designed to be water-smart.
SWAN Systems² was trialled for its capacity to make a meaningful contribution to reinforcing the development’s sustainability rating. Leatherback Oval, a sporting oval within Alkimos Beach, was selected as one of the trial sites for SWAN Systems.
Challenges
Alkimos Beach is a high profile “innovation through demonstration” development. The sustainability initiatives to protect the pristine nature of Alkimos Beach include a move towards carbon-neutral living, including water conservation, energy reduction and reduced waste.
Leatherback Oval is a key community facility and is used by the school and local sporting teams. As such, it is very important for the site to be safe and consistently display a high standard of presentation. The challenge was to meet these requirements during the development phase while ensuring water and nutrient waste was minimal.
When the trial started Matt Alvaro, maintenance manager from Total Eden, said their aim was to improve their proficiency in data driven water management. Priority measures for this were identified as maximum water and energy efficiency per hectare, and optimal health of the landscape. As well, access to satellite NDVI readings would enable Total Eden to keep a close eye on turf condition and act as a check on the impact of practice changes.
How SWAN Systems Helped
Total Eden commenced an internal trial in January 2018 with the objective to use the information provided by SWAN Systems to reduce planned watering, to bring soil moisture levels within a target range determined by the soil type, and to measure performance against actual landscape health.

Once SWAN’s cloud based system was configured for soil, irrigation system and turf characteristics, data connections were established with flow meters, soil moisture sensors, weather forecasts and observations to complete the requirements for smart water management.
The irrigation system was initially run as normal and SWAN used to review and evaluate the information available. Matt Alvaro reported: “We all learn a lot every time we do a review [using SWAN] and are confident in our decisions as there is greater certainty than our normal assessment provides. This is important when it comes to deciding what adjustments to make because the evidence is before us and the supervisory and operational staff are on the same page.”
Results and Future Plans
The site was undergoing amendment/rehabilitation during the trial period. Nevertheless, with continuous review and tracking of soil moisture there were significant cutbacks in the amount of water being applied.
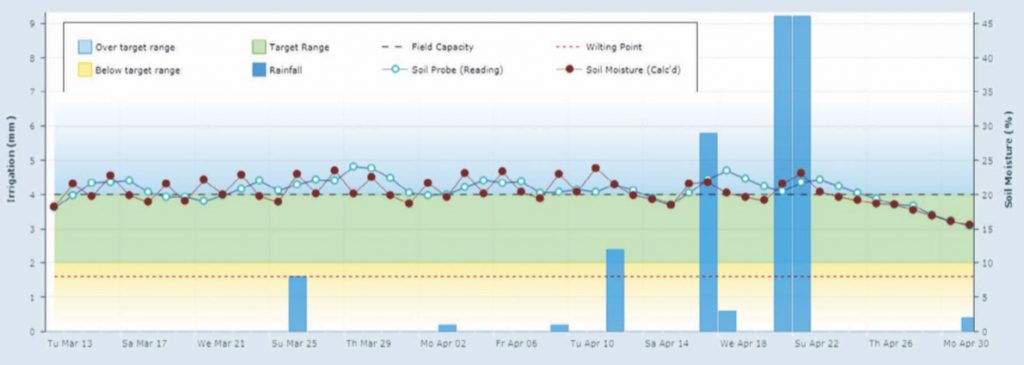
Figure 1: Screenshot of automatic data analysis for Leatherback Oval, comparing soil moisture probe (SMP) data with SWAN’s calculated soil moisture status. SMP data are used as a cross-check of the soil moisture status calculated by SWAN. In the case of Leatherback Oval, the trends shown by the SMP display close correlation with the values calculated based on site settings, weather and flow meter data. This gives confidence in the model’s validity. (Note that for clarity, the irrigation data are not shown on the chart, but are still factored into the soil moisture calculations. Each of the higher points in the ‘Soil Moisture (Calc’d)’ line on the graph corresponds to an irrigation event.)
“We discovered the application rate of some stations was significantly higher than the design figure” said Matt. “Our initial decision was to make a large cut back to run times of 30%, which showed improvement in soil moisture and allowed us to make further proactive adjustments for the following month. We aim to continue to calibrate the run cycles [see Figure 1] until we have a fit with what SWAN is saying is the optimum soil moisture and we can check plant performance is okay using the satellite imagery and field inspection.”
We estimated the energy saving was 4,500 kWh/ha, which is equivalent to $1,270/ha, or 3.4 tCO2/ha.
The satellite imagery provided a record of turf health from winter through to autumn. Figure 2 shows a series of NDVI images from January to April 2018. The results of a number of management events can be observed. The oval had fertiliser application in late spring (November 2017), followed by a pump breakdown over the New Year period (January 2018). Following this, extensive renovation of the oval, including fertiliser application, was done during January. A further foliar fertiliser application was done in late March.
Accordingly, the oval exhibited its lowest NDVI (indicating the poorest turf health) in January. Later imagery shows gradual turf recovery peaking in April 2018, reflecting the success of the renovation and other management improvements.
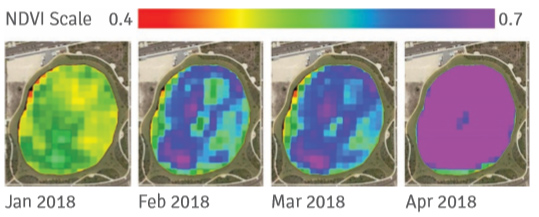
Figure 2: NDVI imagery of Leatherback Oval indicating turf recovery, January to April 2018. The colours in the images correspond to the NDVI value as shown in the scale; higher index value means healthier (greener) turf.
Matt Alvaro said irrigation programs were switched off “Auto” mode much sooner before June 1st than they would have done without the assistance of SWAN Systems. He also anticipated a later start post-August 30th. “These shoulder months are crucial times to reduce overall annual water consumption and SWAN Systems allows us to match our water applications to hard data.”
He concluded that SWAN Systems’ calculated soil moisture balance appeared to be a good reference for irrigation programming going forward.
Matt has advised “It is Total Eden’s intention to continue with SWAN Systems at Alkimos Beach and continue to improve their ability to manage the estate’s water usage responsibly and in a sustainable manner.”
Footnotes
1 – Normalised Difference Vegetation Index: provides a measure of plant health by assessing the amount of live green vegetation present.
2 – SWAN is a cloud-based system that can automatically collect and store weather, irrigation, soil moisture, and fertiliser application data. The software analyses the data to provide recommendations for optimised irrigation – it takes the guesswork out of optimising water use. It also provides integrated modules for nutrient planning and management, and satellite data is used to generate a health (or “greenness”) index for sites based on absorption and reflectance data
Are you ready to start making data-backed decisions around water and nutrient allocation? Discover how the SWAN difference can help your business meet your growth and efficiency goals – contact us or book a free demo today.
